

The climate risk industry is built on a premise: banks get climate risk wrong because they lack data. Better emissions data. Higher-resolution flood maps. More granular scenario pathways. The solution, according to the major vendors, is to buy more data.
Moody’s, ranked #1 in Chartis’s Physical Risk benchmark, models climate hazards at property level. MSCI’s recent study mapped 500,000 physical assets and found 55% of companies already face severe hazards. S&P and Oliver Wyman built Climate Credit Analytics, now used by Citi and others for regulatory stress testing.
These are valuable products. But they address the wrong bottleneck.
What actually happens at banks
A risk team buys the data. Emissions from CDP, flood maps from Moody’s, scenarios from NGFS, credit methodology from Oliver Wyman. They feed it into their risk system and run a stress test.
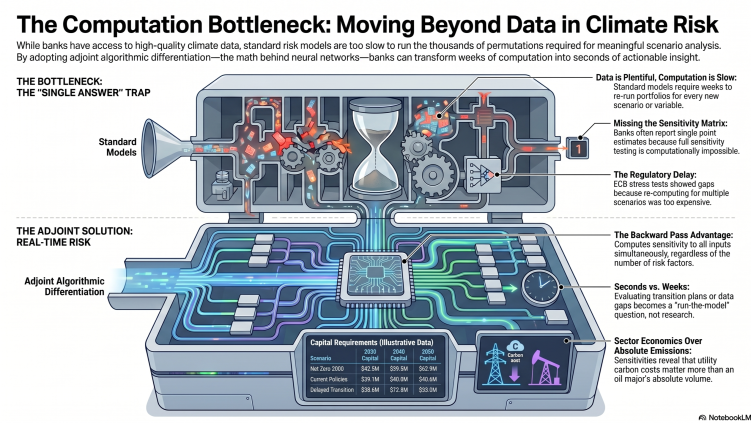
The first run takes days. Results arrive. The CFO asks: “What if we assume EU ETS carbon price doubles by 2030 instead of 2035?” They rerun. Days again. The board asks: “Show me Delayed Transition instead of Net Zero.” Days again. Someone on the risk committee asks: “How sensitive is the capital number to our assumption about RWE’s transition plan?” Nobody knows, because answering that question requires another full rerun.
By the time three scenarios are complete, the regulatory deadline has passed. They submit what they have, with caveats.
This is not speculation. The ECB’s 2022 climate stress test, the first supervisory exercise requiring banks to project credit risk parameters up to three decades under multiple climate scenarios, produced results with acknowledged gaps and approximations. Not because the data was poor. Because the computation was too expensive to complete properly.
The gap between data and decisions
Better data improves the accuracy of a single answer. But climate risk isn’t a single-answer problem. It’s a scenario problem. The NGFS publishes six pathways. Regulators want three time horizons. Each pathway has different carbon prices, GDP impacts, temperature trajectories, and energy mix assumptions. And for each combination, the bank needs to know how sensitive the result is to its own modelling choices: PD assumptions, LGD models, sector classifications, Scope 3 estimates.
The full matrix is enormous. Six scenarios times three horizons times sensitivity to risk factors times thousands of counterparties. Under the standard approach (change one input, revalue everything, repeat) a bank with 20 climate risk factors needs 40+ full portfolio revaluations to populate a sensitivity table. If each takes hours, the full analysis takes weeks.
So banks don’t do it. They run one or two scenarios, report point estimates without sensitivities, and move on. The data they bought sits underutilised because they can’t recompute fast enough to explore what it means.
A different approach
There is a technique, well established in other fields, that computes the sensitivity of any output to all inputs simultaneously in a single backward pass. It’s called adjoint algorithmic differentiation. It’s the same mathematics that trains neural networks; the backward pass in backpropagation is an instance of it.
Applied to climate risk: evaluate the portfolio once under a scenario (forward pass), then run one backward pass. The result is , , , , all at once. The cost of the backward pass is roughly 3-4x the forward pass, regardless of how many risk factors you differentiate against.
This isn’t theoretical. Adjoint methods have been used for decades in weather forecasting (ECMWF’s data assimilation system), aerodynamic design (Airbus, Boeing), and derivatives pricing (CVA/XVA at tier-1 banks). Climate risk just hasn’t adopted them yet.
What the output looks like
We built a prototype to show what becomes possible. Five illustrative counterparties: two oil majors, a European utility, a technology company, and a bank. $5.8 billion total exposure. Approximate emissions from public reporting. Textbook credit parameters. Three NGFS scenarios.
The NGFS capital matrix:
| Scenario | 2030 | 2040 | 2050 |
|---|---|---|---|
| Net Zero 2050 | $42.5M | $59.5M | $82.9M |
| Current Policies | $39.1M | $40.0M | $40.6M |
| Delayed Transition | $38.8M | $72.8M | $93.0M |
Regulatory capital (10.5% of climate-stressed RWA) for the illustrative portfolio.
Current Policies looks stable, capital barely moves. That’s misleading. Low carbon costs keep credit quality steady, but this scenario leads to 3.8°C warming. The physical damage is real. It just doesn’t show up in transition-focused capital metrics.
Delayed Transition is the worst outcome. Capital nearly triples because you get both physical damage from decades of inaction and a sudden carbon price spike (600 in five years) when policy finally shifts. Counterparties that had no time to adapt face stranded assets and carbon costs simultaneously.
The climate buffer, the difference between worst and base case, is 500 billion in exposure, scale accordingly.
More revealing than the headline numbers is the per-counterparty breakdown. RWE, a European utility, shows more carbon sensitivity than ExxonMobil and Shell combined. Not because it emits more in absolute terms, but because its carbon cost as a fraction of revenue is five times higher. A $1/tCO₂ increase in carbon price costs RWE $342K in additional expected loss versus $66K for ExxonMobil. Sector economics matter more than absolute emissions. That finding only emerges when you can compute per-counterparty sensitivities efficiently.
What the prototype actually computes
The capital table above comes from a credit risk overlay. We also built a full end-to-end XVA prototype that does something more substantial: it co-simulates interest rates (Hull-White) and carbon prices (GBM), reprices actual interest rate swaps at each scenario time step, applies per-counterparty climate-adjusted hazard rates and LGD, computes netting within each counterparty, and aggregates to portfolio CVA.
The test portfolio: five counterparties (ExxonMobil, RWE, ArcelorMittal, Microsoft, JPMorgan), 17 swaps total, a mix of payer and receiver, 2-year to 10-year maturities, $40M to $300M notional each. Total book: $2.065 billion. Each counterparty has a different carbon sensitivity parameter based on sector. RWE (Utilities, ) is far more exposed than Microsoft (Technology, ).
Results from 500 Monte Carlo scenarios, computed in 59 milliseconds:
- Portfolio CVA: $3.5 million (0.17% of notional)
- Carbon delta: $2,122 per $1/tCO₂ increase in carbon price
- CVA increase from $50 to $500/tCO₂: +18%
- Netting benefit: 37%, payer and receiver trades within the same counterparty partially offset
- Sector concentration: 87% of the portfolio’s carbon sensitivity comes from the three carbon-intensive counterparties, even though they represent less than 35% of total notional
What changes when computation is fast
When the full scenario matrix recomputes in seconds instead of weeks:
Assumptions become testable. “What if RWE cuts emissions 50% by 2035?” Recompute. Now you can price transition plans rather than ignore them.
Data gaps become quantifiable. “We’re missing Scope 3 for 40% of the portfolio. Does it matter?” Run with estimates, run without. The sensitivity tells you whether investing in better data would change any decision.
Regulatory submissions become defensible. Instead of point estimates with methodology notes, submit results with full sensitivity tables: “Our capital estimate is $X, most sensitive to carbon price assumption (plus or minus $Y per $10/tCO₂), with the following assumptions ranked by impact.”
The board gets answers in real time. “Show me Delayed Transition.” Done. “Now with 20% higher emissions for our energy book.” Done. “What’s our exposure if the EU ETS merges with a global carbon market at $200/tCO₂?” Done.
The climate risk industry has built excellent telescopes. The data and scenarios are good. What’s missing is the ability to point the telescope in a different direction without waiting a week for the image to render.
NGFS scenario data: Network for Greening the Financial System Phase 5 (2024). Portfolio is illustrative. Implemented using AADC, a commercial adjoint AD compiler (matlogica.com). Originally published on LinkedIn.